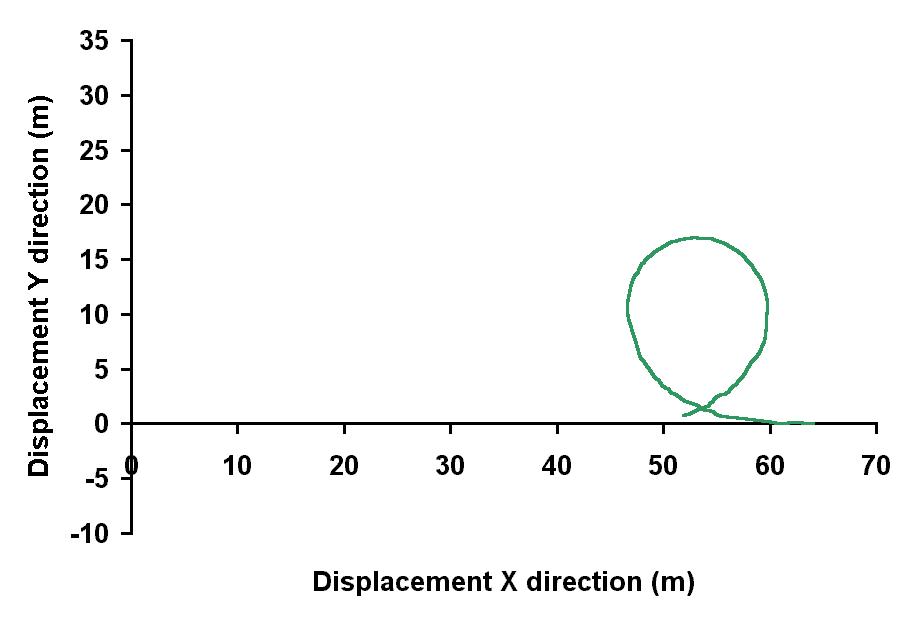
Montazooma's Revenge: In addition to collecting accelerometer readings, the loop portion
of the ride was filmed using a digital video camera. The video was
then analysied using VideoPointä.
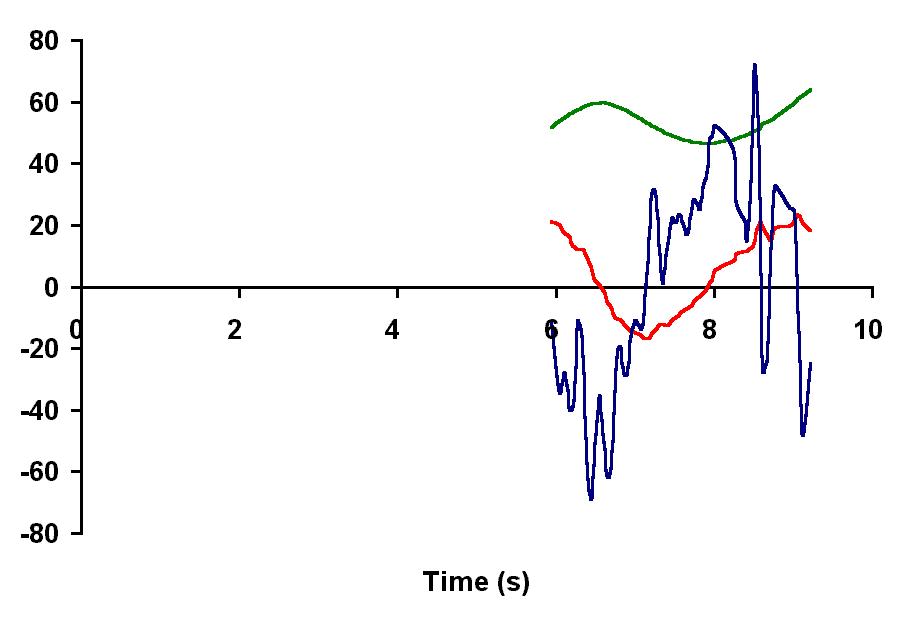
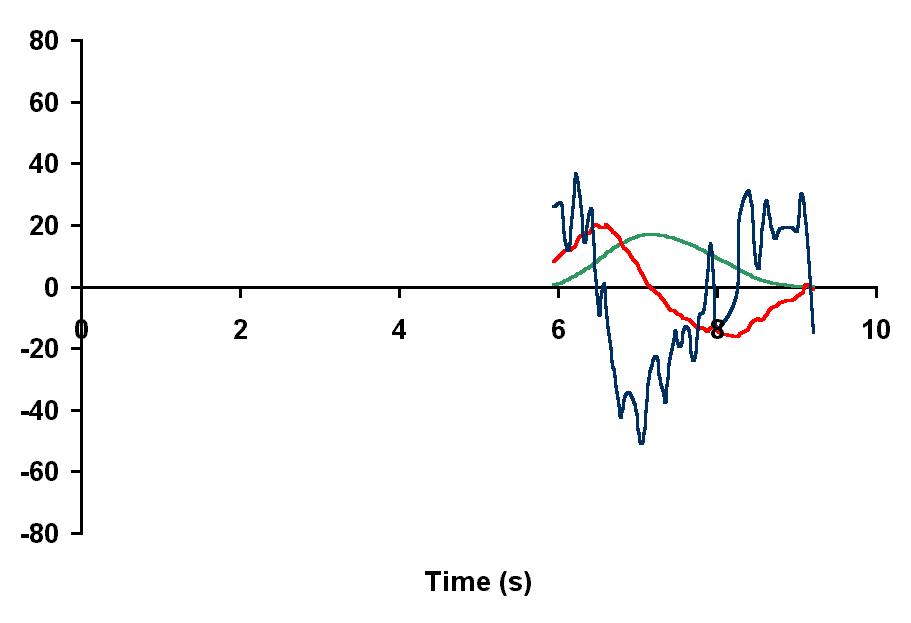
By scaleing pixels and using the encoded time information, VideoPoint generates
position vs. time plots. The position vs. time graphs were then differenciated
twice using Graphical Analysisä.