Experiment E1110 Constant Velocity in Two Dimensions
Discussion
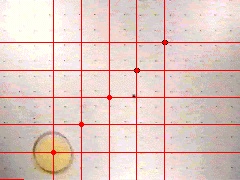
Figure 1 shows a picture of a puck moving from lower left to upper right across the video screen. This is the positive x and positive y directions. The puck is on an air table. An air table provides a cushion of air and reduces friction. Both the x and y directions, in this video, are horizontal. The video was taken using a tripod with the camera pointed down at the air table.
The Model
Table 1. Two dimensional equations for constant velocity.
| x direction |
y direction |
magnitude |
direction |
| x = xo + vxot |
y = yo + vyot |
(x2 + y2)0.5 |
tan-1(y/x) |
| Dx = vxot |
Dy = vyot |
(Dx2 + Dy2)0.5 |
tan-1(Dy/Dx) |
| vx = vxo |
vy = vyo |
(vx2 + vy2)0.5 |
tan-1(vy/vx) |
| px = mvxo |
py = mvyo |
(px2 + py2)0.5 |
tan-1(py/px) |
Notice that if you know xo, yo,
vxo, vyo and m, then you can write all the equations above as functions of time. Here, xo is the x position, in meters, at t = 0, yo is the y position, in meters, at t = 0, vxo is the x velocity, in m/s, at t = 0, vyo is the y velocity, in m/s, at t = 0 and m is the object's mass in kg.
The additional x and y subscripts are now needed because there are two different directions of motion. These subscripts are identifiers and tell us which direction is being discussed.
Marking the Video
Click here to open the video.
- Play the video and observe the motion.
- Starting at time zero, put the mouse cursor on the center of the puck and press the left mouse button. A red circle will appear.
- Step the video forward by pressing the right mouse button while the
cursor is in the video window, or by pressing the left mouse button on
the STEP button. Put the mouse cursor on the center of the puck and press the left mouse button again. Another red circle will appear. Continue marking the puck until the video does not step anymore.
- What are your observations? Is the puck moving in the positive x, negative x, positive y, or negative y direction(s)? Describe the spacing of the circles. Select the Lines menu option in the Menu bar above the video, then select Both. You should see vertical and horizontal lines passing through all the data points. Your video should now look similar to Figure 1 above. Describe the spacing of the lines. Use the Circles-Vectors menu item and observe the velocity and momentum directions.
- Based on your observations, make rough sketches (no numbers, just the general shape) of the position, displacement, velocity and momentum versus time graphs in both the x and y directions. Mark the horizontal and vertical axes with the correct variables and write the general equations for your graphs. You should verify if your sketches are correct when you view these graphs.
Graphical Analysis
- Press the GRAPHS Button and the Data Analysis Choices will appear. Pick Option 1, then click the Next button.
- Direction of Motion? Pick x first. You will analyze y later, then both x and y. Click the Next button.
- From the plots options, select position, velocity and momentum. Click the Next button.
- The first thing you will see is a cover sheet. Write down the mass.
- Find the slope and intercept of the position-versus-time graph. Write the equation for x and put it in a table similar to Table 1 in the Model Section above. Note the additional subscripts. Again, these are identifiers with the subscripts x and y meaning the x and y directions respectively. The subscript, o, means at time zero.
- Check your equation by substituting at least two times off the graph. Do your answers match the graph at these times? Check your equation with the computer.
- Click the Next Graph button and the displacement-versus-time
graph will appear. Write the equation for this graph and put it in your
table. Check your equation against the graph.
- Click the Next Graph button and the velocity-versus-time
graph will appear. Does the velocity appear fairly constant? What is the slope? Put the velocity in your table.
- Calculate the momentum. Check your calculation against the momentum-versus-time graph. Put the momentum in your table.
- Return to the Data Analysis section, and pick y for the Direction of Motion. Repeat Steps 3 through 9 and put your equations in your table.
- Return to the Data Analysis section, and pick both x and y for the Direction of Motion. When you look at the graphs, you will
notice both x and y values are plotted along with a third plot. The third
plot is the magnitude. The direction of motion (angle) is shown with a small line extending from the magnitude data points. For at least two times, calculate values for your table. Notice that the magnitude is the square root of the sum of the squares in that row. The direction is the inverse tangent of each row's y value divided by the x value in that row. Make sure you find the correct quadrant in your calculations.