Experiment E1205 Impulse in One Dimension
Discussion
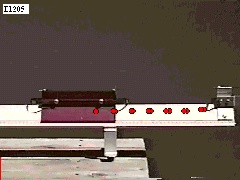
Figure 1 shows a picture of an air glider traveling on an air track. An air track provides a cushion of air and reduces friction. Initially, the glider is traveling right. When it reaches the end of the air track it hits a spring. The spring interacts with the glider and causes it to rebound and travel in the opposite direction.
The Model
New Definitions:
- a = Dv/Dt is the definition for acceleration in terms of velocity and time. In words, the acceleration is the slope of a velocity-versus-time graph. The units of acceleration are the units of velocity divided by the units of time. This is m/s/s or m/s2.
- Fnet = Dp/Dt is the definition for net force in terms of momentum and time. In words, the net force is the slope of a momentum-versus-time graph. The units of force are the units of momentum divided by the units of time. This is kg.m/s/s or kg.m/s2. This combination of units has the name newton (N) in honor of Isaac Newton. The relationship is: 1 N = 1 kg.m/s2. See Newton's Laws in any physics text for more information.
- Impulse = FnetDt is the definition for impulse. In words, impulse is the net force multiplied by the time that it acts.
- FnetDt = Dp is the relationship between impulse and momentum. This says that a net force acting for a finite time causes the object's momentum to change. The cause ( a net force acting) produces the effect (a change in momentum).
Remembering that p = mv then:
Dp = D(mv)
If the mass is constant (does not change) then:
Dp = mDv
Then dividing both sides by the change in time gives:
Dp/Dt = mDv/Dt
Finally, using Definitions 1 and 2, this is:
Fnet = ma
This last statement says that a net force acting on a mass causes the mass to accelerate. The cause ( a net force acting) produces the effect (an acceleration).
Examining these definitions and equations, we can make the following statements:
- If the velocity changes, then there is an acceleration. If Dv is positive, then the acceleration is positive. If Dv is negative, then the acceleration is negative. Or, the acceleration and the change in velocity have the same sign.
- If the momentum changes, then there is a net force. If Dp is positive, then the net force is positive. If Dp is negative, then the net force is negative. Or, the net force and the change in momentum have the same sign.
- If the acceleration is positive, then the net force is positive. If the acceleration is negative, then the net force is negative. Or, the net force and the acceleration have the same sign. This is true because the mass is positive.
- If the acceleration is zero, then the net force is zero. You will learn later that zero net force does not necessarily mean no forces are acting on the object.
- If an object's velocity changes then the object is accelerating (by definition) and there must be a net force that causes this acceleration. You will learn later how to identify various forces and apply them to predict an object's motion.
- If an object's momentum changes then there must be an impulse that causes this change. Therefore, there must be a net force acting for some finite time.
Marking the Video
Click here to open the video.
- Play the video and observe the motion.
- Mark a point on the object until the video does not step any more.
- What are your observations? Is the object moving in the positive x, negative x, positive y, or negative y direction(s)?
- Select the Circles-Show Current menu item. This will display only the current frame's data circle. Now select Circles and then Vectors - Direction of v and a menu item. This will show the directions of the velocity and acceleration. Step through the video. When is there an acceleration? Is the acceleration in the same direction as the velocity? Is the acceleration in the same direction as the change in velocity?
- Select Circles and then Vectors - Direction of p and Fnet menu item. This will show the directions of the momentum and net force. Step through the video. When is there a net force? Is the net force in the same direction as the momentum? Is the net force in the same direction as the change in momentum?
- Based on your observations, make rough sketches (no numbers, just the general shape) of the position, displacement, velocity and momentum versus time graphs. Mark the horizontal and vertical axes with the correct variables. You should verify if your sketches are correct when you view these graphs.
- Looking at your sketch for velocity versus time, will there be an acceleration during the interaction? If so, will it be positive or negative? See the definition for acceleration in the Model Section.
- Looking at your sketch for momentum versus time, will there be a net force acting during the interaction? If so, will it be positive or negative? See the definition for net force in the Model Section.
- Looking at your sketch for momentum versus time, will there be an impulse? If so, will it be positive or negative? See the definition for impulse in the Model Section.
Graphical Analysis
Note: To review impulse graphs, run the Graph Tutor software that came on this CD.
- Press the GRAPHS Button and the Data Analysis Choices will appear. Pick Option 1, then click the Next button.
- Direction of Motion? Pick the correct direction of motion based on your observations.
- From the plots options, select position, velocity and momentum. Click the Next button.
- The first thing you will see is a cover sheet. Write down the mass.
- Look at the position-versus-time graph. Is it a straight line? Is the slope constant? Is the velocity constant? Is there an acceleration? Is there a net force acting on the object? Review the Model Section if you have problems with these questions.
- Look at the velocity-versus-time graph. Find the time of interaction, this is Dt. Find the change in velocity, this is Dv. Use this information and the mass to find the acceleration and the net force. Using this graph and the mass, draw the momentum-versus-time graph.
- Look at the momentum-versus-time graph. Find the time of interaction, this is Dt. Find the change in momentum, this is Dp. Using this information, find the impulse and the net force. Find the acceleration. Using this graph and the mass, draw the velocity-versus-time graph.
- Review the Model Section and verify the relationships given there.